Find your
slowest pages
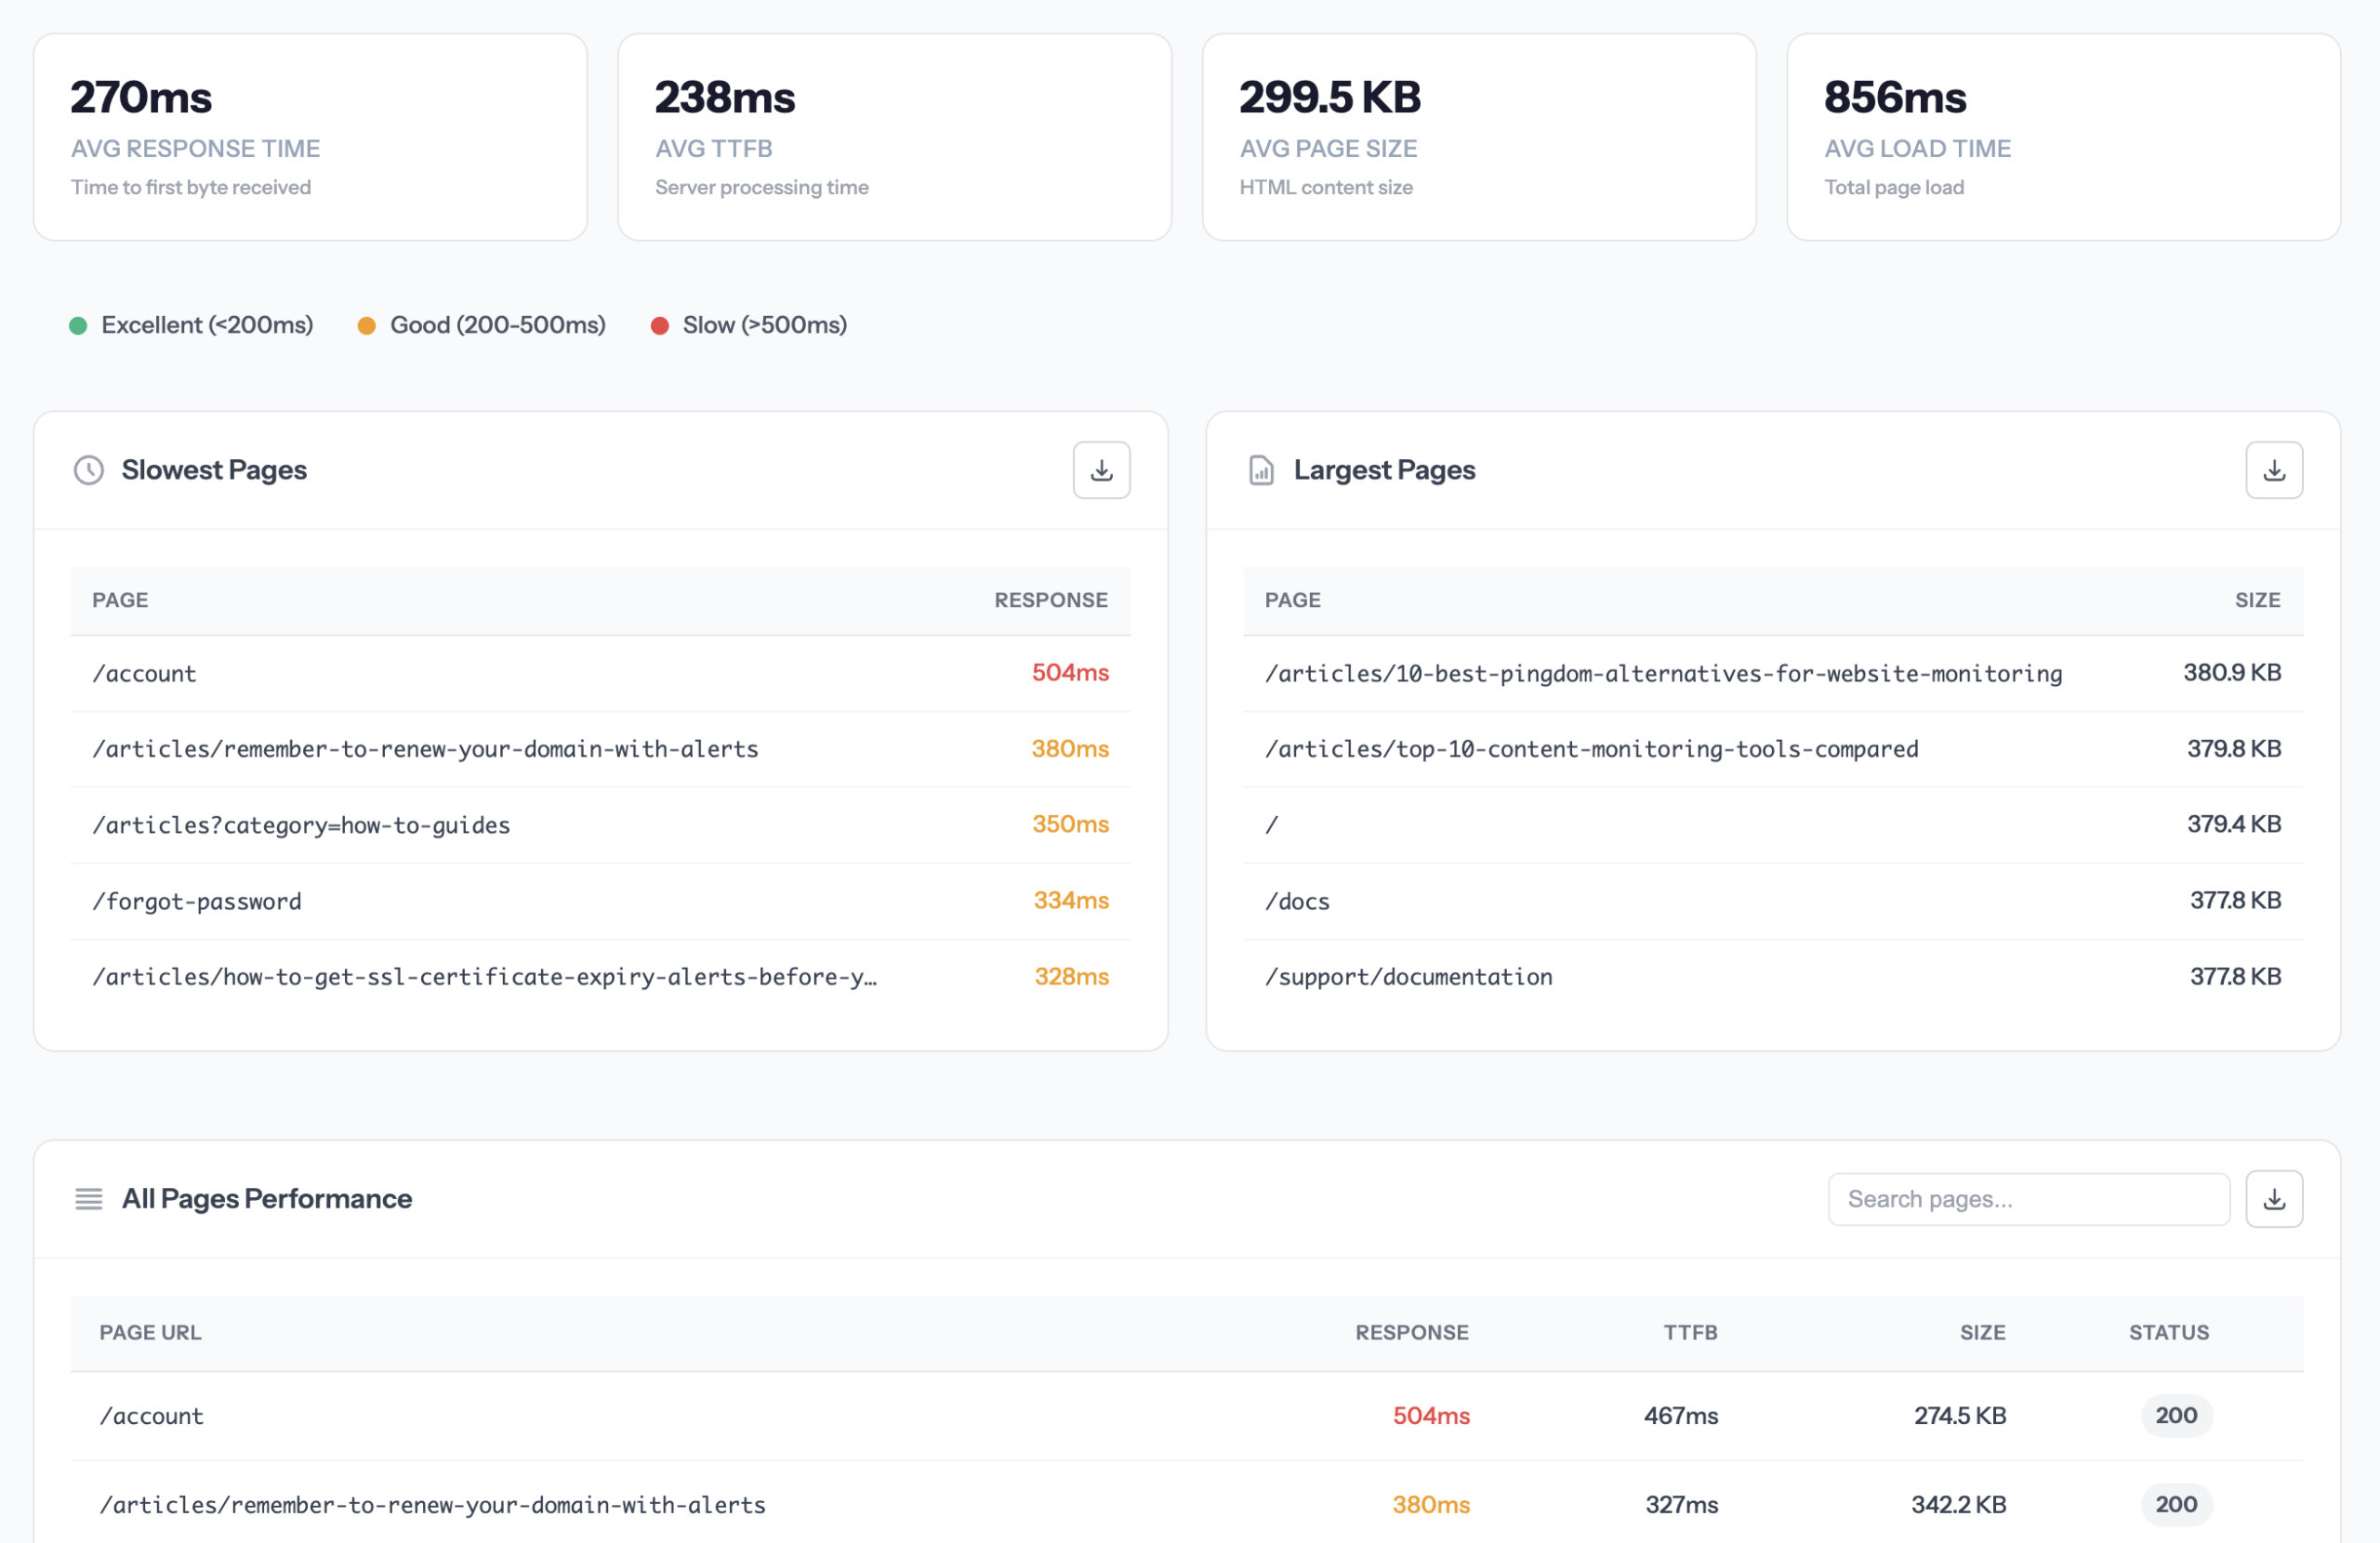
Analyze page speed across your entire website. Identify slow pages, large files, and performance bottlenecks that hurt user experience and SEO.
Performance data that matters
Track the metrics that directly impact user experience and search rankings.
Response Time
Total time from request to fully loaded page. The primary metric for user-perceived speed.
Time to First Byte (TTFB)
How quickly your server responds. A key indicator of server performance and hosting quality.
Page Size
Total download size of the page including HTML, CSS, JS, images, and fonts.
Complete performance visibility
Slowest Pages Report
Instantly identify your worst-performing pages sorted by response time. Know exactly where to focus optimization efforts.
- Sorted by response time
- Filter by page type
- Export to CSV
Performance Distribution
See how your pages break down by speed rating. Understand what percentage of your site is fast vs slow.
- Excellent / Good / Slow breakdown
- Visual pie charts
- Trend over time
Large File Detection
Find oversized images, bloated scripts, and heavy resources that slow down your pages.
- Image size analysis
- Script weight tracking
- Optimization suggestions
Performance Trends
Track how your site speed changes over time. Catch performance regressions before they impact users.
- Historical data
- Before/after comparisons
- Regression alerts
Page-Level Details
Drill into any page to see detailed performance metrics, including content type breakdown.
- Individual page analysis
- Content type breakdown
- Load waterfall (coming soon)
Performance Alerts
Get notified when pages become slow or when overall site performance degrades.
- Threshold-based alerts
- Email notifications
- Configurable sensitivity
Slow pages cost you money
Why monitor performance
Increase Conversions
Faster pages mean better user experience and higher conversion rates. Every millisecond counts.
Improve SEO
Page speed is a ranking factor. Faster sites rank higher in search results.
Better UX
Users expect fast experiences. Slow pages frustrate visitors and damage your brand.
Catch Regressions
Code changes can slow things down. Continuous monitoring catches problems before users complain.
Get performance insights in minutes
Crawl Your Site
Add your website and we’ll crawl every page, measuring response time, TTFB, and page size.
Review Reports
See your slowest pages, performance distribution, and detailed metrics for every URL.
Optimize & Track
Fix slow pages, re-crawl to verify improvements, and set up alerts to catch future regressions.
Find your slow pages today
Get a complete performance report for your entire website in minutes.